Want to be in the loop?
subscribe to
our notification
Business News
SOCIAL - ECONOMIC SITUATION IN 2012
Of 5.03% general pace of the whole economy, the sector of agriculture, forestry and fishery rose 2.72%, contributed 0.44 point percent; the industry and construction by 4.52%, contributed 1.89 points percent; and the service by 6,42%, contributed 2.70 points percent.
+ Gross Domestic Products at current prices
+ Gross Domestic Products at 1994 constant prices
2. Agriculture, forestry and fishery
The production value of this sector at 1994 constant prices in 2012 was estimated to rise 3.4% from 2011, of which agriculture increased by 2.8%; forestry by 6.4% and fishery by 4.5%.
a. Agriculture
Rice: 2012’s rice yield was estimated to reach 43.7 million tons, rising 1.3 million tons from 2011; cultivated area reached 7,753,200 ha, rising 97,800 ha; productivity reached 5,630 kg/ha, rising 90 kg/ha. If 4.8 million tons of maize were added, total grain food production in 2012 was estimated to reach 48.5 million tons, rising 2.6% from 2011.
In rice production this year, winter-spring rice yield reached nearly 20.3 million tons, rose 510,400 tons, cultivated area by 27,600 ha and productivity by 110 kg/ha from last year‘ same crop. Summer rice yield reached 14 million tons, rose 573,300 tons, cultivated area reached 2,659,800 ha, rose 70,300 ha (autumn rice cultivated area in provinces in Mekong delta only rose 31,300 ha); productivity reached 5,250 kg/ha, rose 70 kg/ha. Winter rice yield reached nearly 9.4 million tons, rose 179,600 tons, productivity by 90 kg/ha from same crops last year.
Perennial industrial plants: tea cultivated area was estimated to reach 115,800 ha, rose 1.4%; yield reached 923,100 tons, rose 5%; coffee cultivated area reached 574,200 ha, rose 5.6%, yield reached 1,292,400 tons, rose 1.2%; rubber cultivated area reached 505,800 ha, rose 10%, yield reached 863,600 tons, rose 9.4%; pepper cultivated area reached 46,900 ha, rose 4.2%, yield reached 112,700 tons, rose 0.6% from 2011.
Husbandry: As of 01/10/2012, the country had 26.5 million pigs, decreased by 2.1% against the same period in 2011, of which there were 4 million sows, decreased by 0.5%; 2,627,800 buffalos, reduced by 3.1%; 5,194,200 oxen, reduced by 4.5% (167,000 cows, rose 17%); 308.5 million fowls, declined 4.4% (223.7 million chickens, declined by 3.86%). Live-weight meat production in 2012 was estimated to reach 4.3 million tons, rose 2.5% from last year, of which buffalo meat rose 0.8%; beef by 2.4%; pork by 2%; birds’ meat by 4.8%.
b. Forestry
The concentrated planted area this year reached 187,00 ha, equaling 88.2% against 2011; decentralized planted trees were 169.5 million, rose 0.3%; area under cultivation rose 34.8%; Area under protection rose 12.6%; exploited wood production reached 5,251,000 m3, rose 11.9%, of which exploited wood from planted area occupied over 80%. Total damaged area in 2012 was 3,225 ha, decreased by 18% against 2011, of which fired area was 2,091 ha, rose 19.8%; destroyed area was 1,134 ha, declined by 48.2%.
c. Fishery
2012’s total estimated fishing production reached 5,732,900 tons, rose 5.2% from 2011, of which there were 4,343,700 tons of fish, rose 5.3%; and 632,700 tons of shrimp, rose 0.3%. Aquaculture area in 2012 was at an estimation of 1,059,000 ha, rose 0.7% from last year, of which area for raising catfish was 11,500 ha, rose 3.4%; area for raising Penaeus monodon (the giant tiger prawn) was 599,200 ha, declined 1.4%; area for raising White-leg shrimp was 34,300 ha, rose 17.2%.
Aquaculture production was at an estimation of 3,110,700 tons, rose 6.1% from 2011, of which there were 2,402,200 tons of fish, rose 6.5% and 473,900 tons of shrimp, decline 1%. Catfish production in 2012 reached 1,22600 tons, rose 3% from 2011. Catching production in 2012 reached 2,622,200 tons, rose 4.3% from 2011, of which sea catching gained 2,418,000 tons, rose 4.8%.
+ Cultivation progression of agricultural crops as of December15, 2012
+ Production value of agriculture, forestry & fishery
+ Cultivated area, productivity and yield of main crops
+ Cultivated area, productivity and yield of selected annual industrial plants
+ Cultivated area, productivity and yield of selected perennial industrial plants
+ Outcome of forestry production
+ Fishing production
3. Industry
December’s Industrial Production Index (IPI) was estimated to rise 5.0% from November and by 5.9% from the same period last year. 2012’s IPI rose 4.8% from 2011, of which mining and quarrying rose 3.5%; manufacturing by 4.5%; power and gas by 12.3%; water supply and waste management by 8.4%.
The consumption index for the manufacturing in 11 months of this year rose 3.6% from last year’ same period. The stock index as of 01/12/2012 for the whole manufacturing sector rose 20.1% from last year’ same period.
+ Industrial production index
+ Main industrial products
4. Service
a. Total retailed sales of consumer goods and services
As estimated, 2012’s total retailed sales of consumer goods and services rose 16% from 2011 (if the factor of inflation were excluded, it would be 6.2%), of which the state economic sector took 12.3% and decreased by 1.2%; the non-state economic sector took 84.8% and increased by 18.4%; the FDI sector took 2.9% and increased by 34.7%. Considering by business sector, trade business took 77.1% of the total and rose 15.2%; hotel and restaurant 11.8% and by 17.2%; service 10.1% and by 19.6%; tourist 1% and by 28.1% respectively.
+ Total retail sales of consumer goods and services
b. Carriage of passengers and cargos
2012’s passenger carriage was estimated to rise 12.2% by passengers carried and 9.5% by passengers-kilometers carried from 2011, of which central transport rose 7.4% and 6.5%; local transport rose 12.3% and 10.1% respectively. Land transport was estimated to rise 13.4% by passengers carried and 11.1% by passengers-kilometers carried; river transport reduced 3.4% and 3.7%; air transport declined 0.2% and rose 7.6%; sea transport reduced 2.4% and 1.5%; rail transport rose 2% and 0.7% respectively from last year.
2012’s cargo carriage was estimated to increase 9.5% by tons carried and decreased 8.7% by tons-kilometers carried from last year, of which the domestic transport rose 10.4% by tons carried and 1.7% by tons-kilometers carried; the overseas transport reduced 12.4% and 14.8% respectively. Land transport rose 11.5% and 8.7%; river transport rose 6.8% and 5.7%; sea transport reduced 14% and 16%; rail transport reduced 3.9% and 3.4% respectively.
+ Passenger carriage by volume and traffic volume
+ Cargo carriage by volume and traffic volume
c. Postal and communicational services
2012’s new telephone subscribers reached 12.5 million, rose 5.5% from last year, including 16,500 desk telephone subscribers, equaling 33.4% from 2011 and 12.5 million mobile phone subscribers, rose 5.8%. The number of telephone subscribers over the country as late December 2012 was at an estimation of 136.6 million, rose 2.7% from last year’ same period, including 14.9 million desk telephone subscribers, reduced 2.9% and 121.7 million mobile phone subscribers, rose 3.5%. The number of new broadband internet subscribers in 2012 was 355,600. As of late December, total internet subscribers over the country were at an estimation of 4.3 million, rose 5.4% from last year’ same period. 2012’s total postal and communicational service net income was at an estimation of 179.9 trillion dongs rose 7.6% from 2011.
d. International visitors to Viet Nam
International visitors to Viet Nam in 2012 were at an estimation of 6,647,700 arrivals, rose 9.5% from last year. Of which, visitors coming for tourist purposes were 4,170,900 arrivals, rose 7.3%; for business purposes 1,166,000 arrivals, rose 16.2%; for visiting relatives 1,150,900 arrivals, rose 14.3%.
+ International visitors to Vietnam
II. CURB INFLATION, STABILISE MACROECONOMY
1. Price indexes
a. Consumer Price Indexes (CPI)
December’s CPI rose 0.27% from November and 6.81% from 12/2011. 2012’s average CPI rose 9.21% from that in 2011.
Groups of goods and services having higher CPI than the general pace of December compared to the previous month were garments, hats and footgear by 1.17%; family appliances by 0.59%; culture, entertainment and tourist by 0.34%; drinks and tobacco by 0,32%; catering and related service by 0.28% (grain food by 0.13%; foodstuff by 0.28%; outdoor eating and drinking by 0.4%). Other groups having lower CPI than the general rate or decreased were housing and construction material by 0.15%; medicine and medical service by 0.14% (medical service by 0.03%); education by 0.09% (educational service by 0.05%); transport declined by 0.43 and postal and communicational service by 0.02%.
Looking back in 2012, December’s CPI rose 6.81% from the same period in 2011, which was close to 2009’s 6.52% pace, and much lower than 2010’s 11.75% pace and 2011’s 18,13% pace but this was a year of many unusual changes. Concretely, CPI did not rise too highly in the two beginning months of the year (by1.0% in January and by 1.37% in January) but it jumped to the peak in September with 2.20% pace, mainly due to the impact of groups of medicine and medical service and education. CPI has increased slowly in late months of the year[1], this showed the timeliness and effectiveness of implementation of the Instruction No. 25/CT-TTg dated 26/9/2012 by the Prime Minister on strengthening the management and stabilization of prices. Another unusual thing of the domestic price market this year was that CPI did not decrease in the month immediately after the Lunar Tet holidays but in the two midyear months (June and July).
About groups of goods, food and foodstuff had lower paces than the general (food by 3.26%, foodstuff by 8.14%, average CPI rose 9.21%), while in 2011 this group had the highest CPI and much higher than the general pace. Whereas, CPI of the medical service had great change with a rapid pace, and CPI of the education, although decreased as compared with the previous year was still at high level.
b. Producer price indexes (PPI)
In 2012, PPI for agricultural, forest and fishing products rose 3.91% from 2011, of which PPI for agricultural products rose 1.05%; for forest products by 14.26% and for aquatic products by 13.78%. PPI for industrial products rose 9.32% from 2011, of which PPI for mining rose 19.10%; for manufacturing by 7.1%; for power by 9.9%; and for water supply by 14.45%. Raw materials price indexes (RMPI) for domestic production rose 9.04% from 2011. Transport charge indexes (TCI) rose 13.2% from 2011. Export price index decreased by 0.54% against 2011. Import price index decreased by 0.33% against 2011.
+ Consumer price indexes, gold & USD price indexes, December 2012
+ Producers’ Price Indexes for agricultural, forestry and fishing Products 4th Quarter of 2012
+ Producers’ price indexes for industrial products 4th Quarter of 2012
+ Price indexes of materials used for production 4th Quarter of 2012
+ Export price indexes in 4th Quarter of 2012
+ Import price indexes in 4th Quarter of 2012
+ Transport charge indexes in 4th Quarter of 2012
2. Construction, investment development
a. Construction
2012’s construction production value at current prices was at an estimation of 720.2 trillion dongs, of which the state sector reached 112.9 trillion dongs; the non-state sector 583.2 trillion dongs and the FDI sector 24.1 trillion dongs. Construction production value at 1994 constant prices was at an estimation of 229.6 trillion dongs, rose 2.1% from 2011, of which the state sector reached 36.5 trillion dongs, declined by 3.9%; the non-state sector 185.7 trillion dongs, rose by 3.5%; the FDI sector 7.4 trillion dongs, reduced by 0.3%.
b. Investment development
2012’s realized social investment capital at current prices was at an estimation of 989.3 trillion dongs, rose 7% from 2011 and equaled 33.5% of GDP. Of which state capital was 374.3 trillion dongs, rose by 9.6%; the non-state sector 385 trillion dongs, by 8.1%and the FDI sector 230 trillion dongs, by 1.4%. Of the state sector’s investment capital, fund from the state budget was 205 trillion dongs, rose 15% from 2011. Of which, capital under central management was 50.3 trillion dongs, rose by 15.4%; and capital under local management 154.7 trillion dongs, by14.9%.
+ Realized development investments under State Budget
+ Licensed FDI projects, 01/01- 15/12/2012
3. Exports-Imports
a. Exports
December’s export turnovers were at an estimation of 10.4 billion USD, rose 0.5% from November and by 15% against 2011. Generally, export turnovers in 2012 reached 114.6 billion USD, rose 18.3% from 2011, of which the domestic economic sector gained 42.3 billion USD, increased by 1.3% and the FDI sector (including crude oil) 72.3 billion USD, by 31.2% respectively. If crude oil were excluded export turnovers of the FDI sector this year would reach 63.9 billion USD and rise 33.5% from 2011. If inflation were excluded, 2012’s export turnovers would increase by 18.9%.
The increase in export turnovers this year mainly lay in the FDI sector with such exported goods as electronics, computers and components; telephones of all kinds and components, textile, footwear... All these items belong to the group of goods with high processing proportion, this reflects low export effectiveness and real revenue of foreign currency.
There was a change in structure of export turnovers in this year against last year: heavy industrial and mineral goods reached an estimation of 51.7 billion USD, rose 49.9% and represented 45.1% (the figure in 2011 was 35.6%), mainly due to increase in turnovers of exported telephones and components, an estimation of 6.2 billion USD (by 97.7%). Light industrial and handicraft goods gained 39 billion USD, equal the figure in 2011 but their share in export turnovers declined from 40.3% in 2011 to 34.1% in 2012. Agricultural and forestry products gained 17.7 billion USD, rose 18% from 2011 but their share in export turnovers was unchanged with 15.4% rate. Aquatic products reached 6.2 billion USD, approximate to 2011 and their share declined from 6.3% in 2011 to 5.4% in2012.
About markets for exportation in 2012, EU rose to be the largest one with 20.3 billion USD, rose 22.5% from 2011 and represented 17.7% of total export turnovers.
b. Imports
December’s import turnovers were at an estimation of 10.6 billion USD, rose 6.5% from November and by 13% from 2011. 2012’s import turnovers reached 114.3 billion USD, rose 7.1% from 2011, of which the domestic economic sector gained 54 billion USD, decreased by 6.7%; the FDI sector reached 60.3 billion USD, increased by 23.5%. This was the slowest pace since 2002 (excluding 2009). If inflammation were excluded, 2012’s import turnovers would rise 7.4% from 2011.
The structure of import turnovers this year also had a change against 2011, the group of means of production reached an estimation of 106.5 billion USD, represented the highest share of 93.2%, higher than 2011’s 90.6% pace, mainly as the density of the group of imported machinery, equipment and accessories related to assembling goods for exportation rose from 29% to 36.9%. The group of raw materials represented 56.3%, decreased against last year’s 61.6%; the group of consumer goods gained 7.8 billion USD, represented 6.8%, decreased against last year’s 7.6%.
About markets for importation, China was still the largest one with 28.9 billion USD, rose 17.6% from 2011 and represented 25.3% of total import turnovers; following were ASEAN with 21 billion USD, rose 0.3% and represented 18.3%; Republic of Korea 15.6 billion USD, by 18.4% and 13.6%; Japan 11.7 billion USD, by 12.2% and 10.2%; EU 8.8 billion USD, by 13.3% and 7.7%; the United States 4.7 billion USD, by 4.7% and 4.1% respectively.
2012’s trade surplus was 284 million USD and this was the first year Viet Nam had trade surplus since1993, of which the FDI sector had trade surplus of about 12 billion USD, focusing on assembled goods. Contrarily, the domestic sector had trade deficit of 11.7 billion USD.
c. Export-import of service
2012’s exported service turnovers were at an estimation of 9.4 billion USD, rose 6.3% from 2011, of which tourist service reached 6.6 billion USD, increased by 18%; transport service 2.1 billion USD decreased by15.5%. 2012’s imported service turnovers were at an estimation of 12.5 billion USD, rose 5.7% from 2011, of which transport service reached 8.7 billion USD, increased by 6%; tourist service 1.9 billion USD by 8.5%. Service trade gap in 2012 was 3.1 billion USD, rose 3.8% from 2011 and equaled 32.8% of 2012’s exported service turnovers.
+ Exports
+ Imports
III. SOCIAL ISSUES
1. Population, labor and employment
Average population in 2012 were estimated at 88.78 million, rose 1.06% from 2011, of which men were 43.92 million, rose 1.09%; women were 44.86 million, rose 1.04%. Of the country’s total population, population in urban area were 28.81 million, rose 3.3% from 2011; population in rural area were 59.97 million and rose 0.02%.
2012’s total birth rate reached 2.05 babies/woman, higher than 2011’s 1.99 babies/woman level. Crude birth rate reached 16.9 lively newborns per 1,000 population. Sex ratio of newborns was 112.3 male newborns /100 female newborns, higher than the level of 111.9 male newborns /100 female newborns in 2011. Crude death rate was 7‰; death rate of babies under 1 year of age was 15.8‰; death rate of babies under 5 years of age was 23.8‰. Manpower aged 15 and above in 2012 were 52.58 million, rose 2.3% from 2011, of which men represented 51.3%; women represented 48.7%. Laborers aged 15 and above having jobs in 2012 were 51.69 million, rose 2.7% from 2011. Structure of laborers aged 15 and above having jobs decreased from 48.4% in 2011 to 47.5% in 2012 for the sector of agriculture, forestry and fishery; from 21.3% to 21.1% respectively for the sector of industry and construction; but increased from 30.3% to 31.4% for the sector of service. Of the total manpower, laborers aged 15 and above having jobs in 2012 represented 10.4% for the state sector; 86.3% for the non-state sector and 3.3% for the FDI sector.
Unemployment rate of laborers within the labor working age group in 2012 was1.99%, of which it was 3.25% for urban area and1.42% for rural area. Under-employment rate of laborers within the labor working age group in 2012 was 2.8%, of which it was 1.58% for urban area and 3.35% for rural area. Non-official labor rate in 2012 rose from previous years, from 34.6% in 2010 to 35.8% in 2011 and 36.6% in 2012.
+ Selected indicators on population and manpower
2. People’s living standards
Generally, in the whole year of 2012, the country had 450,300 times of households suffered from food shortage, decreased by 27.6% against 2011, in proportion to 1,911,800 times of hunger persons, decreased by 26.9%. The country’s poor household rate in 2012 was at an estimation of 11.3 – 11.5%, declined 1.1 – 1.3% from 2011, which was lower than 2011’s 1.6% decreased rate against 2010.
3. Education and training
As of late 2012, there were 60/63 provinces and cities over the country meeting standard for compulsory primary education within right age group, of which 03 provinces and cities were recognized as meeting standard for compulsory primary education within right age group at 2nd level and 63/63 provinces and cities met standard for compulsory secondary education. The country had 215 universities, of which 187 were public schools; 204 colleges, of which 150 were public schools and 295 professional secondary schools. The country had 2.2 million students of universities and colleges; 623,000 students of professional secondary schools. There were 142 occupational training colleges, 316 occupational training secondary schools and 850 occupational training centers. 1.9 million times of persons in this year were newly recruited for occupational schools , of which 400,000 times of persons were selected for occupational colleges and secondary schools and 1.5 million times of persons for occupational primary schools.
4. Epidemic diseases
In 2012, the country had 81,800 cases of hemorrhagic fever (67 died); 816 cases of virus encephalitis (18 died); 614 cases of typhoid; 125 cases of meningococcal disease (5 died); 151,100 cases of hand, foot, mouth disease, rose 41.3% from 2011, of which 45 died, decreased by 72.4%.
5. Sports
In some international sport games held in this year, Vietnam won 5 gold medals, 2 silver medals, 3 bronze medals in the World Weightlifting Game; 27 gold medals, 17 silver medals and 16 bronze medals in the Asian Students’ Sporting Festival held in Indonesia and ranked 4th in 7 participated national teams.
For high performance sports, the Vietnam Gymnastics and Sports organized successfully 207 domestic and international prizes; participated in 190 international prizes and sent 31 national teams and individuals to train abroad. In international sporting competitions in 2012, the Vietnamese Team achieved 271 gold medals, 234 silver medals and 154 bronze medals.
6. Traffic accidents
From 16/12/2011 to 15/12/2012, the country had 10,081 cases of traffic accident, killing 9,838 persons and injuring 7624 others. Compared to 2011, cases of traffic accident decreased by 28.1%, the death by 14,1% and the injured by 28.2%. On average, the country in each day in 2012, the country had 28 cases of traffic accident, killing 27 persons and injuring 21 others.
7. Natural calamity
According to reports, in 2012 natural calamity made 700 persons died, gone missing and injured; over 100,000 houses damaged; over 80,000 ha of rice and vegetables suffered from empty loss; nearly 300,000 ha of rice and vegetables flooded and damaged. Total damage caused by natural calamity in 2012 was estimated at over 7 trillion dongs, of which Thai Binh province lost about 1.4 trillion dongs, represented nearly 20% of the country’s total loss value. According to preliminary reports, total aids in cash to impacted provinces were about 8.3 billion dongs.
GENERAL STATISYIC OFFICE
Related News
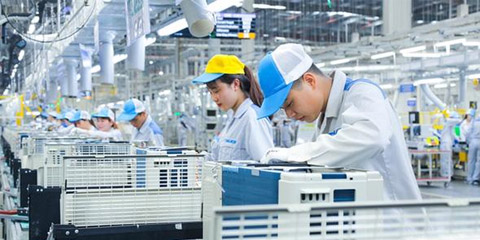
FTA QUALITY IMPROVEMENT PROMOTES EXPORTS: EXPERTS
Enhancing the quality of the 16 free trade agreements (FTA) that Vietnam has signed with partners will be a helpful measure to aid domestic firms in facilitating exports in the coming time, according to experts.

FOREIGN TOURIST ARRIVALS UP 68.3 PC IN FIRST 4 MONTHS
Facilitative visa policies and attractive tourism stimulus programmes have proven effective in attracting a high number of international visitors to Vietnam compared to the same period last year.
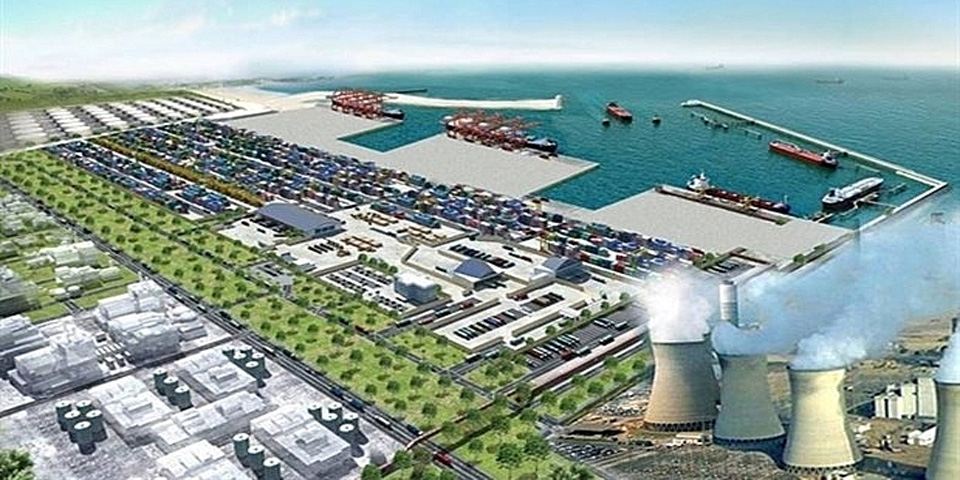
FDI FLOWS STRONGLY INTO MANUFACTURING, REAL ESTATE
According to the General Statistics Office (GSO), the total FDI disbursed in Vietnam in the first four months of this year reached an estimated 6.28 billion USD, up 7.4 per cent year on year, the highest four-month amount in the past five years.

ARE YOU READY FOR THE #HANOIPLAS 2024 IN JUNE?
Let’s join the upcoming HanoiPlas 2024! One of Vietnam's most significant exhibitions in the plastic and rubber industry showcasing innovative technologies and latest industry trend.

INDULGE IN CANTONESE CUISINE WITH E-MEMBERSHIP - NEW WORLD DINING CLUB
With the E-Membership Program - New World Dining Club, freely immerse yourself in the aromas, flavors, and textures of over 40 delicious dishes, rich in the culinary traditions of Guangdong, at Black Vinegar restaurant and many other dining venues at New World Saigon Hotel.

VIET NAM, CHINA TO OPEN NEW BORDER GATE PAIR
The local authorities of Binh Lieu and Hai Ha districts in the northeastern province of Quang Ninh (Viet Nam) and Fang Cheng Zone in China’s Guangxi province have agreed to hold a ceremony to mark the official opening of Hoanh Mo - Dong Zhong Border Gate pair this month.
